
One piece of statistical news we have been sending out monthly is a report showing the different parts of the counties and the loan activity they are experiencing. Refinancing has been a big part of the real estate business these last few years and we thought it would be a good idea to chart that information. We do a chart for the South County, Santa Maria, and Lompoc. It would appear the trend in refinancing has been fairly stable this year with the exception of a couple of months in a couple
 it would be a good idea to chart that information. We do a chart for the South County, Santa Maria, and Lompoc. It would appear the trend in refinancing has been fairly stable this year with the exception of a couple of months in a couple
 areas. Santa Maria seems to be showing a slow decline in the number of refinances, while Lompoc is pretty consistent, and the South County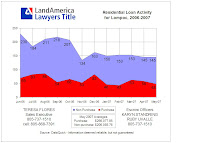 has been up and down so far this year. If you want to view these charts in real size, just click on them and you should be able to view them and print them.
 has been up and down so far this year. If you want to view these charts in real size, just click on them and you should be able to view them and print them.

4 comments:
Great way to present information. Thank you for this resource, Greg. Great job!
Thanks Brody, I'm doing my best!
Greg, Go for it and I'll be on the lookout for "the BLOG."
Thanks Ed, are you working from Hawaii? Travel safe!
Post a Comment